Average UK city house prices outpacing earnings growth by 11%

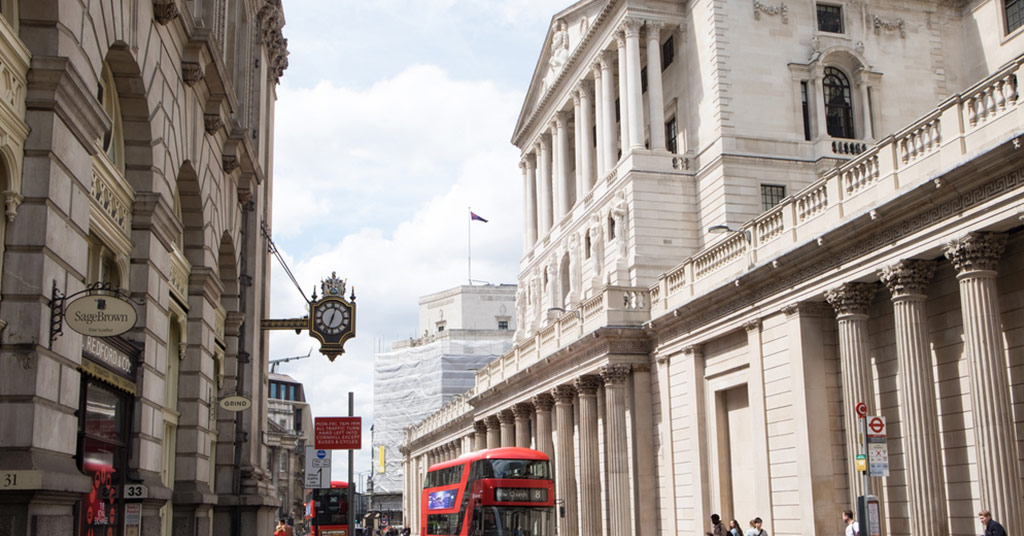
UK’s most and least affordable cities revealed. Source: shutterstock.com
City house prices in the UK have outpaced earnings growth by 11%, causing home affordability to reach on average, its lowest level since 2007, when the ratio of house prices to earnings stood at 7.5, according to Lloyds Bank official website.
The average house price within UK cities has risen from £180,548 in 2013 to its highest ever level of £248,233 in 2018. In comparison, average city annual earnings over the same period have risen by just 11% to £34,366.
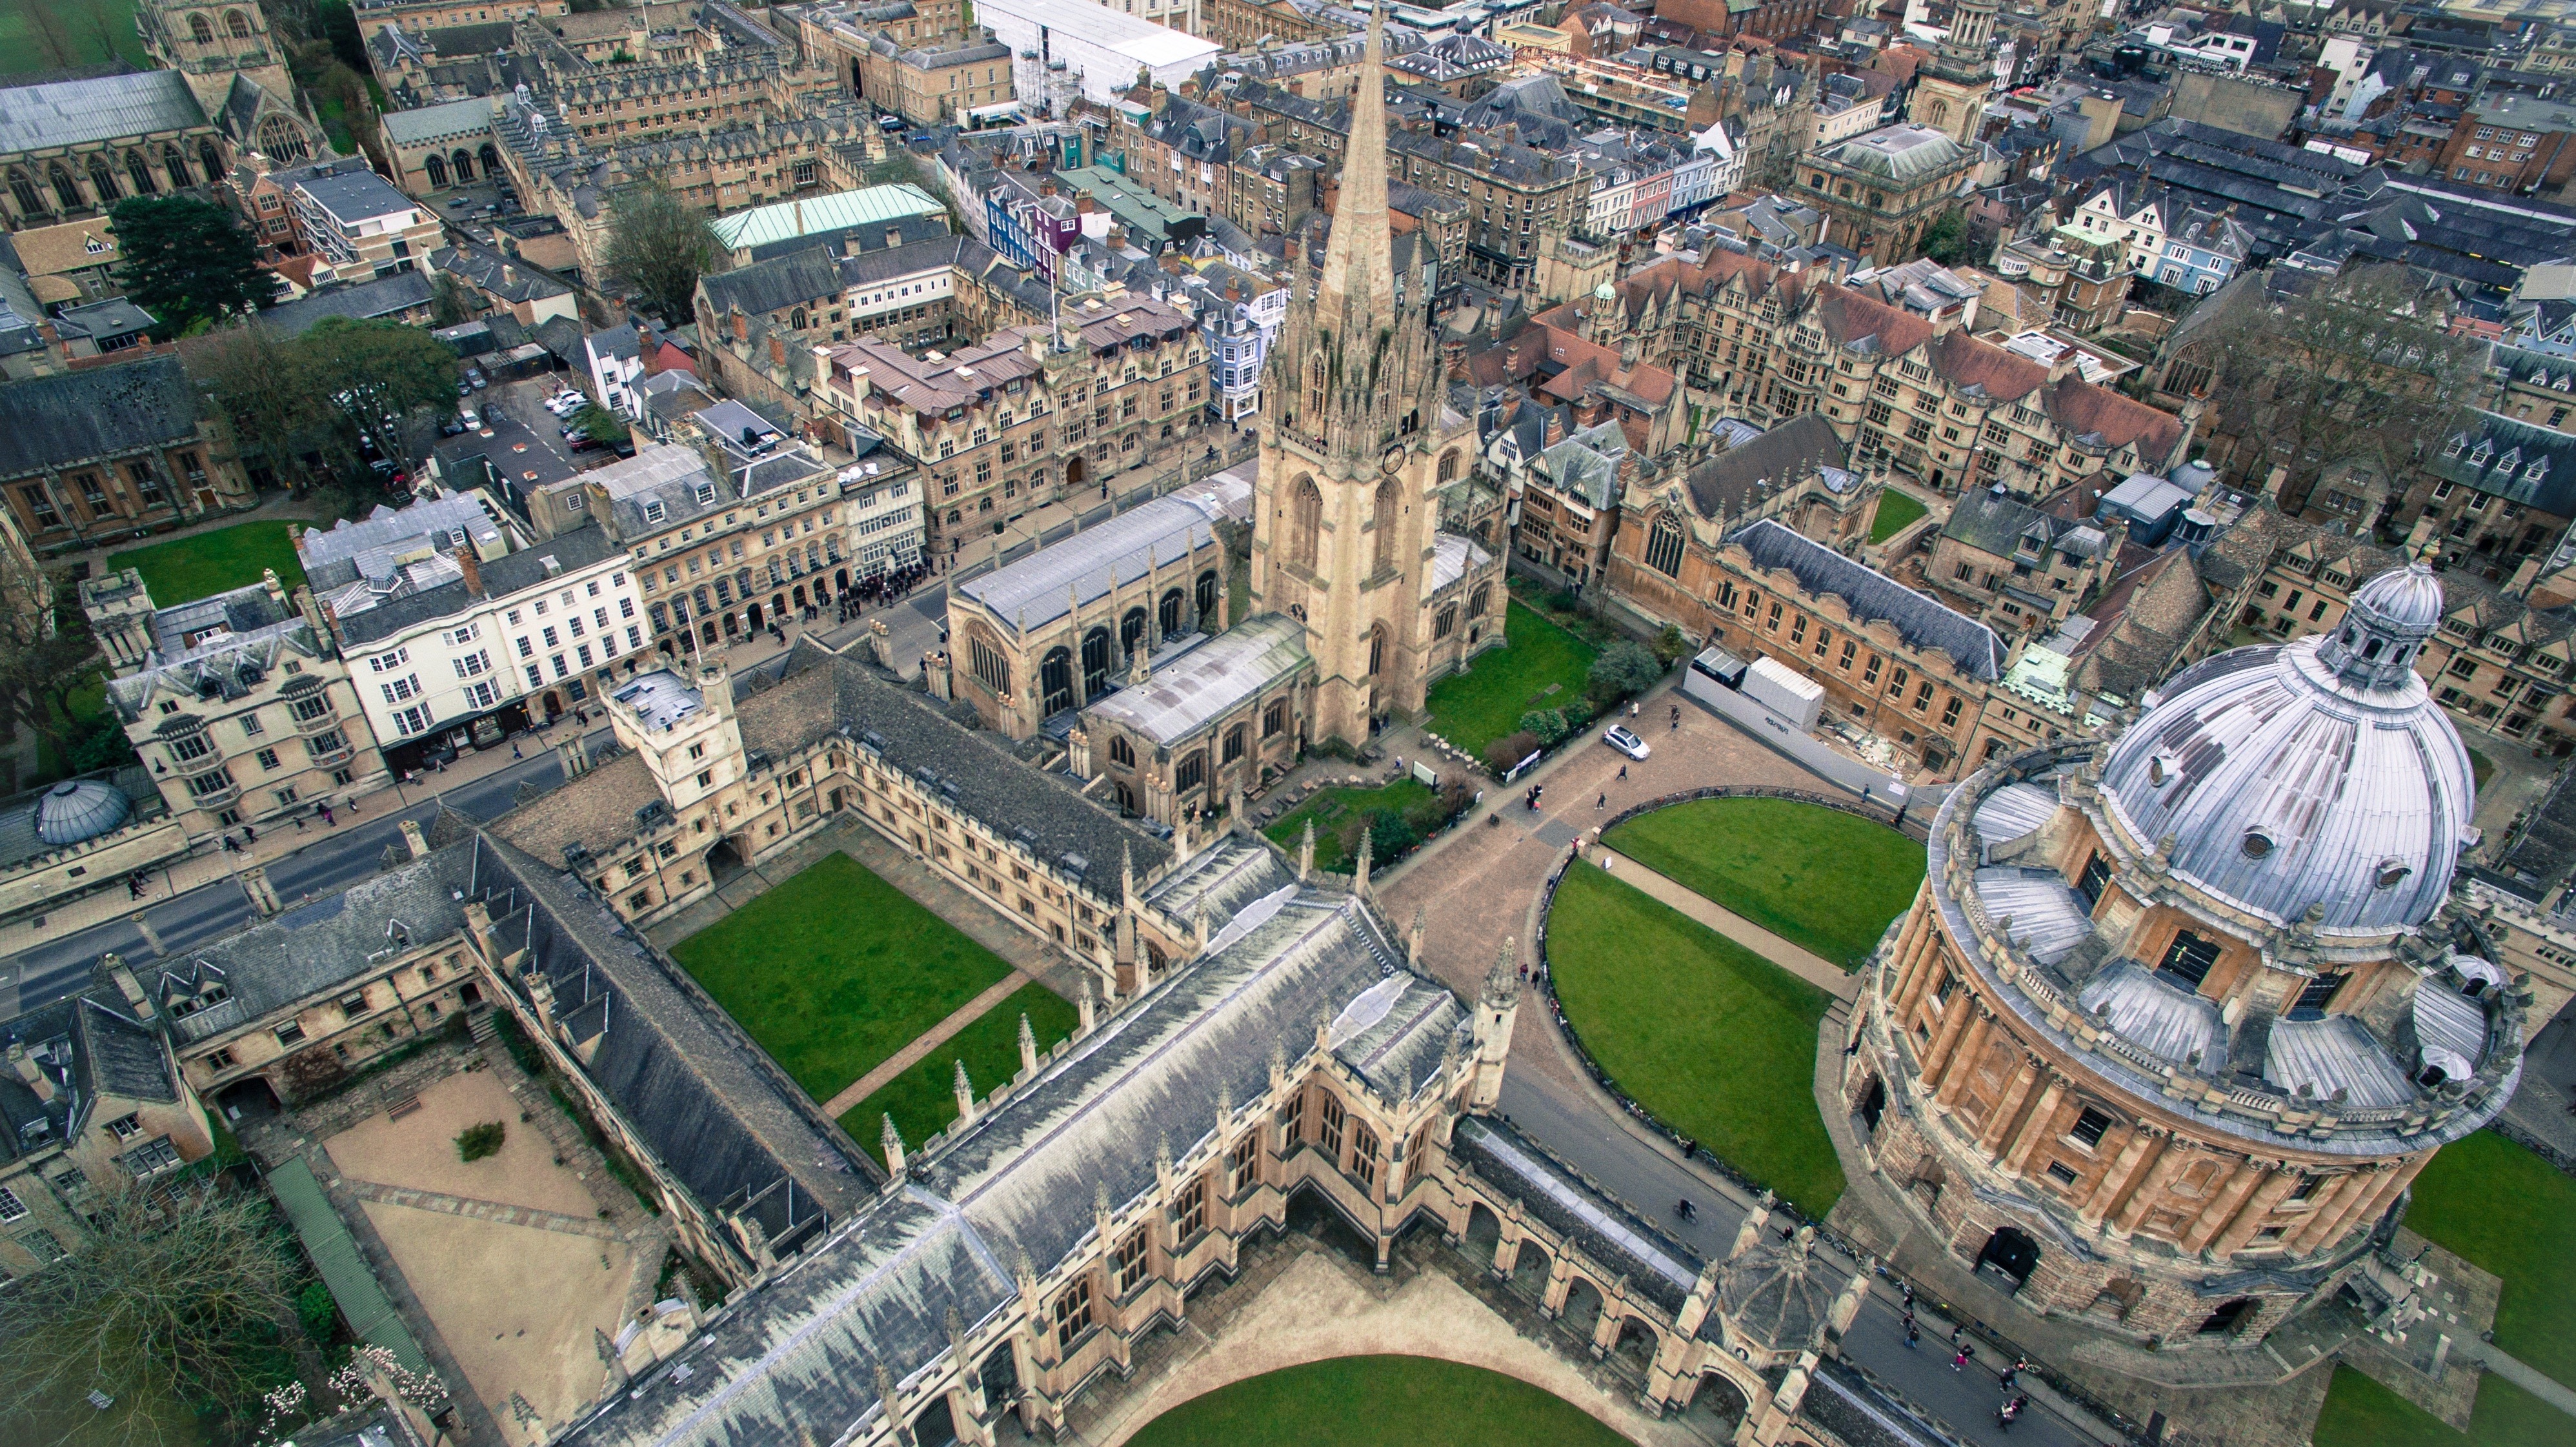
Oxford, home to the world’s highest ranked university has an average house price of £460,184, 12 times (12.6) average annual earnings in the city (£36,430) making Oxford the UK’s least affordable city.
There are seven cities with average house prices above 10 times the average annual earnings. In addition to Oxford, these are Chichester (11.5), Winchester (11.3), Truro (11.1), Greater London, Bath and Cambridge (all 10.3). The London average figure disguises considerable variations across the capital with central boroughs significantly less affordable than the Greater London average.

Oxford is the UK’s least affordable city. Source: unsplash.com
Stirling in Scotland along with Londonderry, Northern Ireland are the UK’s most affordable cities, with an average house price to earnings ratio of 4.4. Stirling is in the top spot for the sixth consecutive year. Along with Londonderry, two other cities in Northern Ireland, Newry (4.5) and Belfast (5.0), are placed 3rd and 6th respectively within the 10 most affordable cities. Bradford (4.6) is named as the most affordable city in England and Swansea, home to nearly 25,000 students, is the most affordable city in Wales (5.5).
Northern English and Scottish cities make up the remainder of the 10 most affordable cities – Lancaster (4.7), Aberdeen (5.0), Perth (5.1) Hereford (5.1) and Sunderland (5.1).
Winchester, England’s ancient capital and home to King Arthur’s legendary Round Tablerecorded the biggest price rise of any UK city over the past decade with a gain of 93% from £281,224 in 2008 to £541,891 in 2018, compared to the UK cities average of 35%. Chichester is second with a rise of 76% followed by Greater London (69%), Cambridge (66%), St Albans (64%) and Oxford (59%). Nine of the 10 top performers since 2008 are in southern England with the exceptions being Lichfield in the West Midlands and Cardiff in Wales (both 54%).
Over the past five years, Chichester has recorded the highest house price growth with a rise of 62% from £277,654 in 2013 to £450,023 in 2018. Cambridge has the second highest increase in average house price (61%), followed by Newcastle upon Tyne (56%), Ely (54%) and Lichfield (52%).
SEE ALSO: Personal budgeting step by step


