To anticipate the core trends and inflection points moving digital assets, traders and investors often get into on-chain analysis. This method provides sophisticated data, offering unique insights into capital flows, asset fundamentals, and market sentiment in public blockchains. As these chains are all publicly available, they enable anybody, anywhere, at any time, to view and analyze every transaction and event that occurs. As a result, traders who apply onchain analysis well are able to make better selections and spot opportunities sooner. Read on to learn what goes on behind the scenes in blockchain data analytics.
Understanding On-Chain Data
First things first, let’s begin with answering what is on chain analysis? This is an approach used in the crypto domain to read raw chain data. It refers to checking various metrics on a network to define the current sentiment of market participants and make price movement forecasts. It incorporates all the details of executed transactions on a chain, or in other words, all details written on the chain blocks. In public networks, such data is accessible to any user, meaning that anyone can watch transactions via reviewers such as CryptoQuant, Santiment, or many others. The data can be broadly classified into three distinct categories:
- Transaction data (i.e. senders’ and receivers’ addresses, amounts, and remaining value for a certain address);
- Block data (i.e. timestamps, miner/validator rewards);
- Wallet data (i.e. address balances and activities, helping to identify whales or substantial asset movements); and
- Smart contract code (i.e. interactions with different dApps).
On-Chain vs. Off-Chain: What Does On-Chain Mean?
To answer “What is on-chain analysis?”, let’s look at another method – off-chain. Generally, offchain transactions can be likened to “offrecord” practices. For example, settling a debt with someone (say, transferring money to X’s account), you can choose your bank or a 3rd-party service like PayPal. Or you can prefer methods such as sharing funding coupons or exchanging passwords. So, you bypass transaction fees banks or third-party providers typically charge.
On the contrary, on-chain solutions guarantee transparency, security, and reliability in forecasting market trends. Let’s consider the differences between these two methods in the table below.
| Feature | On-Chain | Off-Chain |
| Availability | On-chain data lives directly on the blockchain, accessible to anyone in real time. | Off-chain data resides outside the blockchain, often controlled by centralized servers or APIs. |
| Transparency | Transparency is high; everyone can see and verify transactions and data integrity. | Relies on trust in centralized entities to manage and provide accurate information. |
| Immutability | Immutable records once confirmed on the chain. | Data can be altered or deleted by centralized entities or in centralized databases. |
| Security | Relies on cryptographic protocols and consensus mechanisms of the blockchain. | Vulnerable to hacks or manipulations. |
| Speed | Slower due to confirmation times (e.g., in minutes for Bitcoin). | Faster due to centralized control and immediate availability. |
| Forecasting | On-chain provides real-time transaction data and market activity. | Off-chain can be delayed or curated. It can influence the accuracy of market trend forecasts. |
| Reliability | Highly reliable due to consensus algorithms and distributed nature. | Reliability can vary depending on the trustworthiness of data sources. |
| Decentralization | Fully decentralized, no single point of failure, enhancing robustness. | Centralized control over data and operations, potentially vulnerable to central points of failure or censorship. |
The Importance of On-Chain Analysis
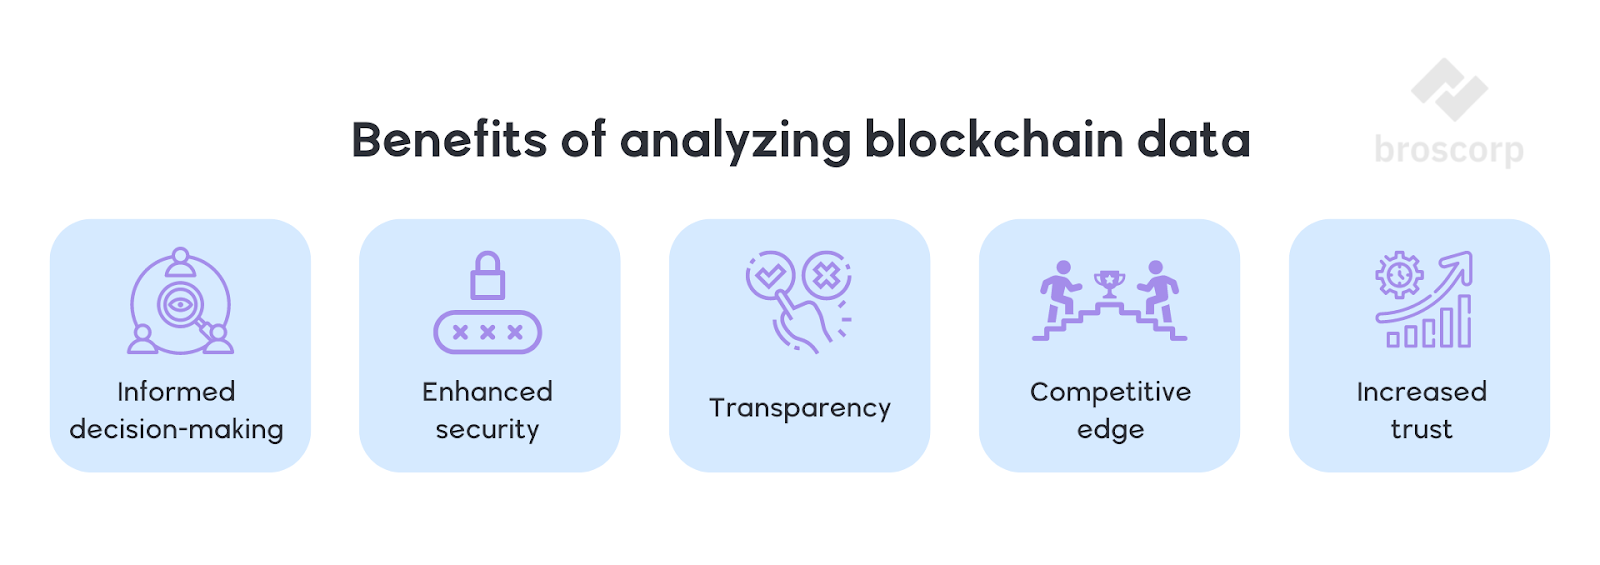
The key advantage of on chain analysis is the possibility of seeing why institutionals acquire or sell a certain coin. Let’s take a closer look at this point. With onchain analysis, you can:
- Track whales’ moves.
- Determine when the market is overbought or oversold to find potential entry or exit points.
- Track changes in market sentiment: are investors and traders in a buying or selling mood?
- Identify market trends: i.e. if the number of active addresses and the transactions executed with one asset increases, we can expect growth. The information showing the number of HODLers also provides useful information: if there are many long-term investors, the general mood is bullish.
You may utilize this information to make your decisions.
Blockchain Data Analysis Use Cases
Below is a list of key use cases for crypto on-chain analysis:
- Transaction analysis: Tracking volumes and patterns of all operations.
- Wallet address monitoring: Monitoring fund movements for compliance.
- Market insights: Understanding trading behaviors and trends.
- Tokenomics analysis: Assessing token distribution and economics.
- Network health monitoring: Monitoring blockchain network metrics to get insights into the overall health and security of a network.
- Smart contract analysis: Auditing and monitoring smart contract behavior.
- Governance and voting: Tracking on-chain governance decisions to track voting participation, outcomes, and stakeholder interests.
- Security monitoring and regulatory compliance: Detecting anomalies and security threats and ensuring transparency to stay in line with AML and KYC regulations.
- Predictive analytics: Forecasting market trends and behaviors with machine learning and predictive modeling.
As you can see, the power of on-chain crypto analysis is not bound to deliver insights to stakeholders in the cryptocurrency ecosystem.
Methods for Analyzing On-Chain Data
Now let’s see how you can read onchain data. You can use the following parameters to anticipate the price action:
- Active addresses: they indicate market trends and can be monitored via special applications.
- Transaction volumes: it reflects activities and demand for specific assets.
- Supply distribution: it shows asset decentralization levels.
- TVL: TVL measures coins staked in DeFi protocols, showcasing how widely used the network is.
NB! On chain data analysis necessitates strong attention to detail as some institutionals make false moves to deceive other investors.
Top 3 Tools for Visualizing On-Chain Data
There is a range of analytics software, each with its own characteristics. Below are three popular options you can use.
Dune Analytics
Dune combines a data platform with analytics tools. It’s a perfect solution for visualizing data, especially, for SQL enthusiasts.
DeFi Llama
This is the largest DeFi data aggregator. It’s highly regarded by analysts but can be complex for newcomers.
Glassnode
This platform is popular for making charts and dashboards for reading broader data. While pro users appreciate its features, some may look for extra indicators.
On-chain data analysis can yield inaccurate indicators from time to time. To avoid losses, do not rely solely on the above-mentioned metrics for investment decisions.
Get Perfect On-Chain Analytics Solutions
On-chain analytics is a powerful add-on to any investor’s or trader’s toolkit. However, as you can see, sometimes, collecting the raw data and turning it into actionable insights is difficult. Find available blockchain analysis tools missing core data? If you are looking for detailed insights for your crypto portfolio, contact Broscorp developers. With Broscorp, you can create customized analytics tools and portfolio management software that help investors use a variety of DeFi metrics, make data-driven decisions, and make a profit.