Account-to-account (A2A) payment systems are spearheading a fundamental shift in global payment infrastructure. They change the familiar payment patterns through the use of direct bank transfers that bypass card networks altogether. Three examples of this rapid evolution occurred in late 2025 and early 2026.

Types of A2A payment systems
Account-to-account (A2A) payments are often discussed aggregately as if they were a single category. But they actually encompass several different types of payment infrastructure serving different purposes.
1. Retail instant payment systems
These are the systems most consumers interact with. They enable individuals and merchants to send money directly between bank accounts for making purchases, paying utility bills or making P2P transfers, usually within seconds. E.g. UPI, Pix, FedNow, Faster Payments, Paynow.
2. Retail batch ACH systems
These A2A systems process payments in batches rather than instantly. They remain the backbone of recurring payments like payroll, government benefits distribution, mortgage payments, etc. in many countries. E.g. National Electronic Funds Transfer (NEFT), Automated Clearing House (ACH).
3. Credit transfer schemes
Banks use these standardized frameworks to move money between accounts, particularly across regions. Unlike a payment network owned by a single operator, these define common rules that participating banks follow. E.g. SEPA
4. High-value wholesale payment systems (HVPS / RTGS)
These systems used by banks, governments, and corporations are designed for the largest and most critical financial transfers with extremely high transaction values that require real-time gross settlement. E.g. Fedwire, CHAPS, BOJ-NET Funds Transfer System
Which category drives the global A2A market?
The main drivers of current A2A market growth would differ depending on the aspect you’re taking into account. From a transaction volume perspective:
- Retail instant systems dominate. UPI, Pix, and similar platforms process billions of payments every month. Quite recently, UPI has even surpassed the industry giant Visa with over 650 million daily transactions.
From a transaction value perspective, however, the situation is quite the opposite:
- High-value and commercial systems dominate. A single payment through Fedwire or TARGET can exceed the value of millions of consumer payments.
Updates Shaping A2A Markets in 2026
In the United States, Federal Reserve Financial Services raised the FedNow Service network transaction limit from $1 million to $10 million in November 2025. That was the second limit increase within a year. The first happened last June when the network transaction limit went up from $500,000 to $1 million. These moves enabled the still-developing A2A system to expand its use cases with support for higher-value payments such as B2B supplier payments, payroll funding, and real estate transactions.
Meanwhile, in the European Union, the Third Payment Services Directive (PSD3) along with its close companion Payment Services Regulation (PSR) cleared a Council of the EU endorsement (COREPER) on April 22, 2026. This regulatory milestone effectively puts the long-negotiated open banking overhaul within months of formal publication.
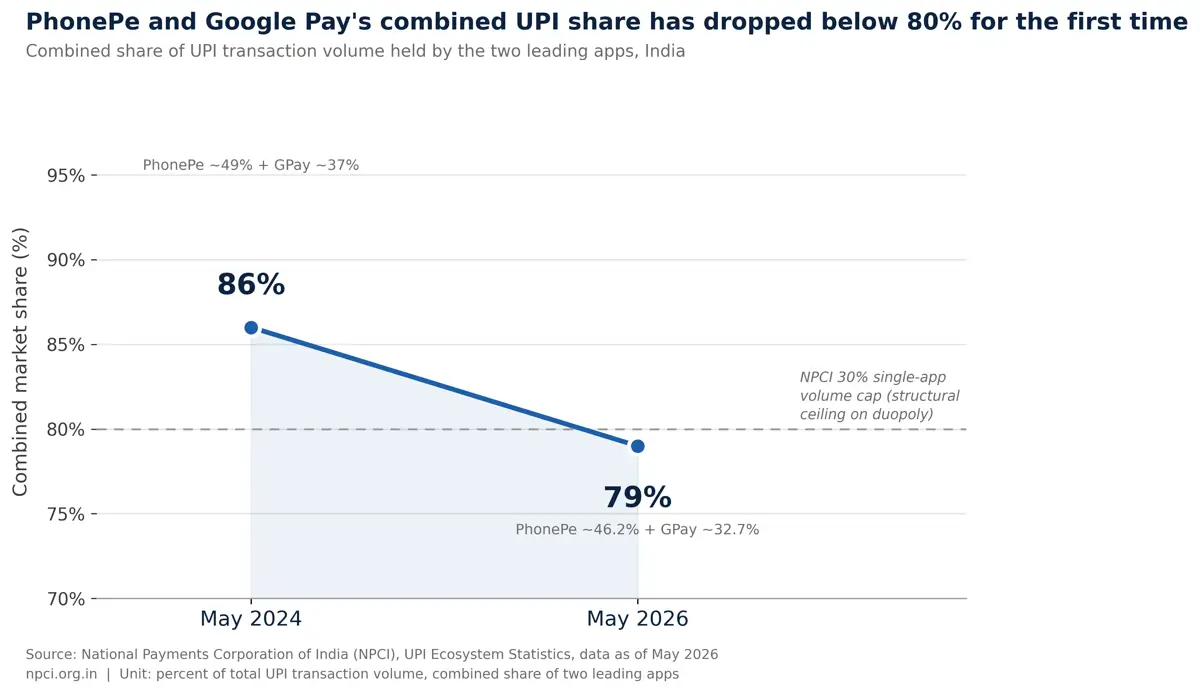
And in India, home to the world’s largest real-time payments scheme by volume, regulatory pressure to diversify the Unified Payments Interface (UPI) ecosystem is starting to make real impact. The combined share of the two leading apps in the country fell below 80% for the first time on record in May 2026.
The A2A ecosystems are growing rapidly all around the world and Juniper Research’s latest projection suggests the market for global A2A transactions could potentially reach $195 trillion USD by 2030 – a 113% increase from the $91.5 trillion on record for 2025.
This article lays out verified numbers about the A2A market as of mid-2026, scrupulously examines what remains a vendor claim or analyst projection rather than settled fact, and explains what the data means for payment service providers, banks, and merchants.
The Global A2A Market in Numbers
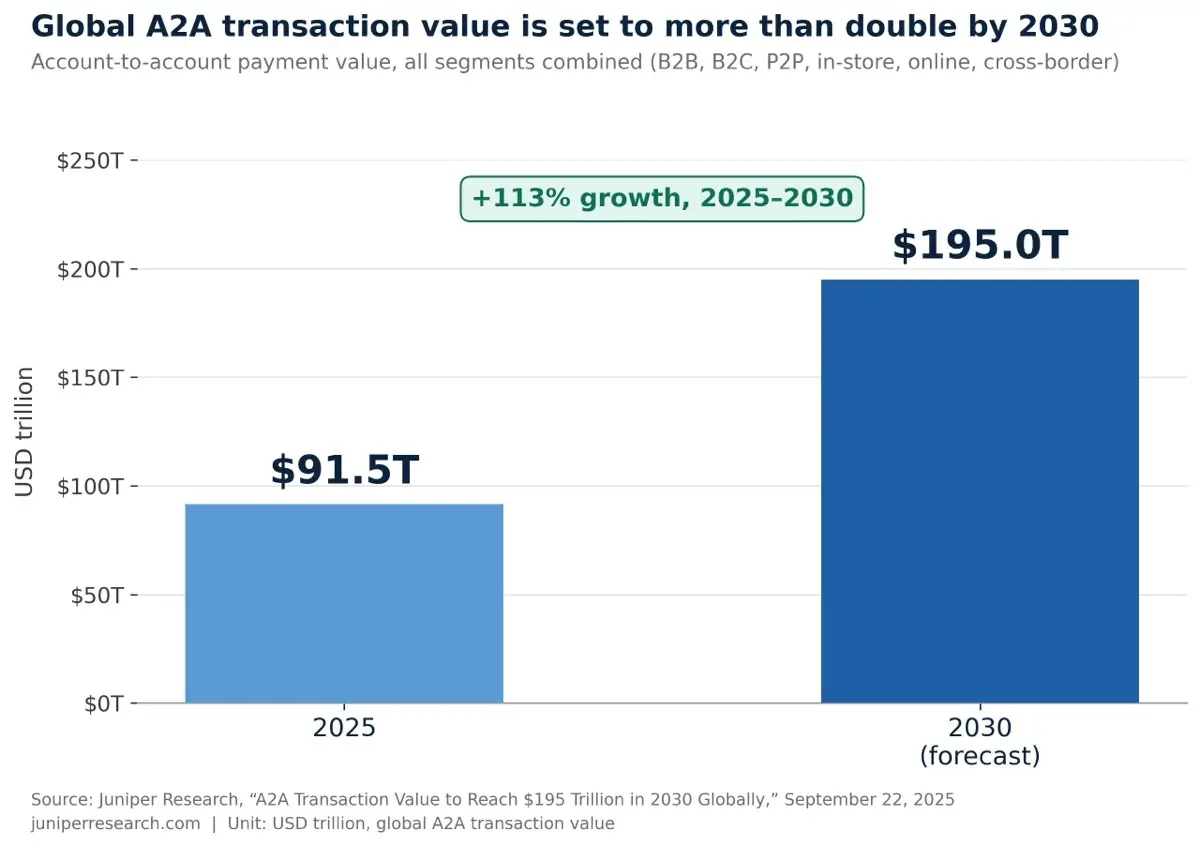
As already mentioned, in September 2025, Juniper Research, UK-based tech market research firm, stated that global A2A transaction value will grow 113% over five years, up from $91.5 trillion in 2025 to $195 trillion in 2030. This optimistic forecast draws data from the firm’s “A2A Payments Market 2025-2030” research suite, which the company says covers more than 60 countries. It attributes much of the projected growth to the rollout of new real-time payment rails and the emergence of value-added services such as Variable Recurring Payments (VRPs) for businesses.
Juniper Research analyst Thomas Wilson commented on a special role of VRPs as a competitive lever:
“VRPs represent a scalable recurring payment solution for businesses that will empower them to improve liquidity and optimise cash flow. Beyond VRPs, recurring payments are a key capability that must be developed to better compete with existing payment methods. By targeting emerging markets, vendors can capitalise by aligning with developing regulatory and market trends.”
Commercial Variable Recurring Payments are not sweeping (me-to-me) transactions frequently used for savings or automated budgeting purposes. Instead, they take place between accounts of different users, developed specifically for enterprises that can receive flexible payments from their customers or business partners and leverage automatic recurring billing systems.
The firm pointed to Brazil’s Pix Automático as an example of strong real-world VRP adoption, contrasted with a slower commercial rollout in the UK market.
Martín Azcue López, Business Development Director at Bizum — Spain’s dominant P2P A2A scheme — noted in a Paypers 2026 industry survey on A2A adoption that 2026 marks “one year after the mandatory adoption of SEPA Instant Payments across Europe through the Instant Payments Regulation,” and that the focus for established A2A schemes is now shifting toward value-added use cases like VRPs and subscriptions, including a planned Bizum Pay NFC wallet targeted for launch in Q2–Q3 2026.
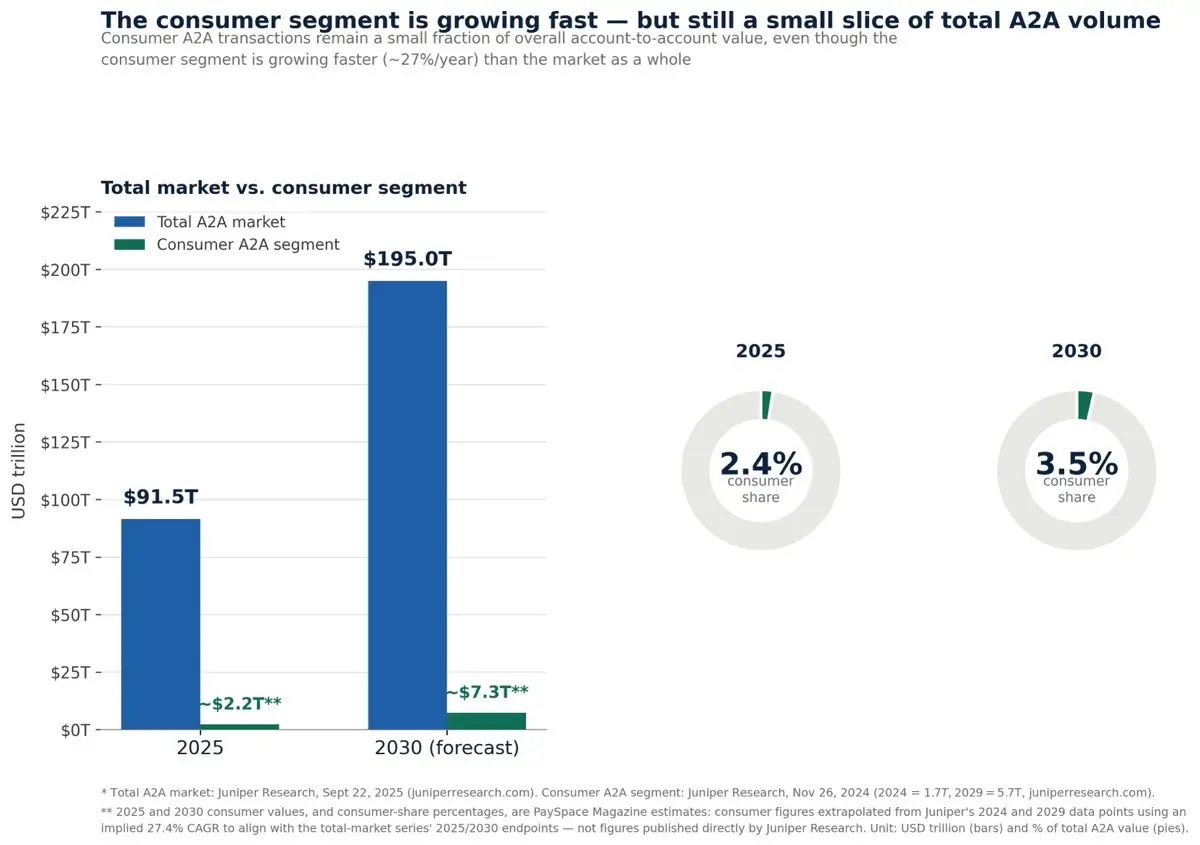
It is worth noting that the $195 trillion figure is part of a larger series of Juniper Research forecasts. In a separate 2024 release focused specifically on consumer A2A payments, the firm projected consumer A2A value would jump from $1.7 trillion in 2024 to $5.7 trillion by 2029 — a 230% increase.
The two figures are not directly comparable. The 2025 forecast (with $195 trillion figure) covers the full A2A market, including B2B, B2C, P2P, in-store, online, and cross-border segments combined, while the 2024 figure addresses consumer transactions specifically.
At the same time, these two research sets reveal an interesting fact. The consumer segment currently is and is expected to remain a relatively small part of the overall A2A market (about 2.4% in 2025 and 3.5% in 2030), even though it is growing much faster than the market as a whole (27.4% per year). It is linked to a typical transaction size that greatly differs in P2P and B2B scenarios, for example. A single corporate A2A payment can be worth millions of dollars, so these segments naturally dominate total transaction value.
Infrastructure in Motion: FedNow and UPI
While FedNow is a rapidly expanding instant payment network in the U.S., we cannot help but wonder how this growth compares to the real-time transactions behemoth like Indian UPI.
The United States: FedNow’s Transaction Ceiling Rises Tenfold
Federal Reserve Financial Services confirmed in a September 2025 announcement that the FedNow Service network transaction limit would rise from $1 million to $10 million, effective November 12, 2025, for customer credit transfers and payment returns. Liquidity management transfers, which previously carried a $2.5 million cap, were raised to the same $10 million ceiling.
Mark Gould, chief payments executive for Federal Reserve Financial Services, described it as the service’s second transaction-limit increase within the year, attributing the change to “growing demand for instant payments” among financial institutions and their business customers. The Federal Reserve’s own figures put FedNow’s participant base at more than 1,400 organizations across all 50 states at the time of the announcement.
The increase brings FedNow into alignment with The Clearing House’s competing RTP network, which has offered a $10 million transaction limit since late 2024. For PSPs and banks, the practical effect is that high-value use cases previously confined to wire transfers or ACH, i.e. large B2B invoice settlement, real estate escrow, corporate treasury movements, etc., can now plausibly migrate to instant-payment rails on either network. Individual financial institutions remain free to set lower limits internally based on their own risk frameworks.
India: A2A at Scale, and a Regulator Working to Loosen a Duopoly
Operational for more than a decade, India’s UPI system today remains the clearest large-scale demonstration of what A2A payments look like once they become default consumer infrastructure rather than an alternative. One of the problems its rapid growth brought along was that just two apps (PhonePe and Google Pay) have handled 86% of UPI volume. Not a monopoly per se, but very close to it. Such market concentration caused regulators and expert concern. However, the once 86% share has started falling in the recent years.
According to data published by the National Payments Corporation of India (NPCI), which operates UPI, the combined market share of PhonePe and Google Pay stood at 86% in May 2024. Two years have passed and by May 2026, NPCI’s own app-wise transaction data already showed that combined share had fallen to 79% — the first time the two leaders have dropped below the 80% threshold since NPCI began publishing per-app statistics. PhonePe alone held approximately 46.2% and Google Pay – about 32.7% as of that month.
The decline reflects deliberate regulatory pressure. NPCI has earlier set a 30% volume cap for any single UPI app.The regulator has twice delayed this rule (most recently pushing the deadline by two years as of a December 2024 decision) but never completely abandoned. To accelerate diversification, NPCI also approved 20 new third-party application providers (TPAPs) in 2024 alone and relaxed feature-parity rules, so that smaller apps can launch exclusive features ahead of the incumbents.
The beneficiaries are visible in the same dataset we mentioned: NPCI’s own BHIM app grew its share roughly fivefold over two years, although it means it had only reached 1%, while Navi (backed by Sachin Bansal) and Flipkart-owned super.money together captured around 5.5% combined since launching roughly two years prior.
So, UPI now has a rare combination of mature, low-friction rail and active anti-concentration regulation. Among other things, this makes Indian payment ecosystem one of the best-known model A2A markets.
As Tareq Shaheen, Product Development Director for Payment Solutions at Eastnets, put it in The Paypers’ 2026 industry survey on A2A adoption: India is “the strongest example” of A2A succeeding as core payment infrastructure rather than a card alternative, achieving scale by embedding A2A “into everyday commerce through QR codes, interoperability, and broad ecosystem participation.”
The Regulatory Landscape: PSD3 and PSR in the European Union
It is inaccurate, as of June 2026, to describe PSD3 as a regulation already governing A2A payments in the EU. It has not yet been formally adopted. However, that legal initiative defines the near future of European payments, being no less important than existing laws in effect.
On June 28, 2023, the European Commission put forth its initial proposal for both the Third Payment Services Directive (PSD3) and a second, new legal instrument called the Payment Services Regulation (PSR) which, like PSD3, also will be directly applicable to payments in the EU. The European Parliament and the Council of the European Union reached a provisional political agreement on each of the two legal instruments on November 27, 2025, after more than two years of negotiations.
The Permanent Representatives Committee of the Council of the European Union (COREPER) convened on April 22, 2026, to endorse the agreed trilogue texts. A vote by the ECON Committee in the European Parliament occurred on May 5, 2026, and a full Parliament plenary vote was supposed to take place in late May, but then rescheduled to June and later postponed to July. There is a currently anticipated timeline for legal-linguistic review and publication in the Official Journal of the European Union (OJEU) somewhere around summer 2026. There are many law firms following this matter such as Freshfields and Norton Rose Fulbright, however, indicating that the deadline may slip to September.
Once published, the PSR is expected to take effect in roughly 18 months. Meanwhile, its most consumer-facing fraud-prevention obligation (mandatory payee-name-to-IBAN verification) is to follow with a 24-month timeline to give institutions time to adapt their systems.
PSD3, as a directive, requires national transposition by EU member states. It generally happens within the same 18-month window, though certain provisions enabling non-bank payment institutions direct access to central-bank payment systems have a shorter six-month transposition period specifically intended to accelerate competitive neutrality between banks and non-bank PSPs.
Meaning of Regulation Changes fo A2A Payments
For A2A specifically, the package matters less because of the open banking provisions inherited from PSD2 (those obligations already exist) but mostly because of two structural changes:
- mandatory dedicated data interfaces with enforced performance parity (closing the loophole that let some banks rely on lower-quality “screen scraping” fallbacks),
- a new fraud-liability regime that puts the burden on PSPs that fail to implement adequate fraud controls, including for impersonation and authorized push payment scams.
The latter is a real risk for A2A’s irrevocable transfers. A recent study has revealed that not only crypto but also increasingly instant account-to-account payments become scammers’ favourite tool in investment schemes. In UK alone, criminals stole £576.4 million through Authorised Push Payment (APP) fraud in 2025.
At the same time, Tarik Zerkti, CEO of MyBank, pointed to sector-specific traction already underway in Europe. In Italy alone, MyBank says it processes around €2.5 billion annually across automotive, energy, utilities, travel, and government payments. That fact can serve as an evidence that A2A adoption in the EU is not waiting for PSD3’s formal entry into force to gain ground.
A2A Economics: What the Cost Comparison Actually Shows
A widely repeated claim in A2A marketing materials is that account-to-account payments cost merchants roughly 0.1–0.5% per transaction versus 0.3–3% for card payments. We were not able to verify a single authoritative, methodologically transparent source for this specific range, so readers should treat it as an illustrative statement rather than a benchmarked industry statistic. Confirmed data is insufficient to create a uniform A2A-versus-card cost comparison at present.
What is available, though, is mass vendor commentary. It cannot be as objective as independent research, for sure. However, to understand at least basic market dynamics, we shall use individual PSP pricing examples.
Thus, Airwallex states on its website that card payments “typically cost businesses 1.5-3.5% per transaction,” while A2A payments through its platform “often cost fixed amounts (£0.20-£1 per transaction) or small percentages.” Using the company’s own worked example, a £10,000 card payment at 2.5% would incur £250 in fees, against an estimated £0.50-£5 for the equivalent A2A transfer.
Separately, Yapily, an open banking infrastructure provider, mentions that A2A payments processed through open banking “typically have lower fees than credit cards or direct debits” because they run on Fast Payment rails rather than card networks, though the company does not publish a specific percentage range to substantiate the comparison.
If we add the two payment systems we already mentioned (UPI and FedNow) to comparison, we clearly see that applicable fees differ on case-to-case basis. Thus, in UPI ecosystem, the network processing fee is government-funded for most standard UPI transactions. Merchant fee is also 0% for standard bank-account UPI payments. Meanwhile, in FedNow case, transactions are typically free for consumers, although banks could choose to charge merchant customers. Network processing fee is $0.045 per credit transfer as of mid-2026.
What the data does support more confidently is where A2A performs best in practice.
Duygu Inanc Koyunpınar, Head of Product at DIMOCO, told The Paypers that A2A “performs best in use cases like P2P, bill payments, and increasingly, ecommerce checkout, where instant confirmation and clear value are visible,” while adoption lags in markets “dominated by more traditional banking models, where UX is less streamlined, and API quality can be inconsistent.”
What This Means for Payment Service Providers and Banks
Reassess transaction-limit assumptions for high-value flows.
The FedNow and RTP limit increases open instant rails to use cases once confined to wire or ACH, such as large B2B payments and real estate escrow. Banks should revisit internal risk limits, since institutions can still cap transactions below the network ceiling. Large businesses now also receive better variability on their B2B payment rails, calling for assessing further payment system criteria/advantages before proceeding to familiar networks.
In markets with concentrated A2A ecosystems, expect regulatory intervention.
India’s narrowing app dominance shows regulators are willing to intervene on A2A concentration. PSPs in markets with similarly dominant providers should expect comparable scrutiny. In such markets, there are higher chances to get a customer share even for small PSPs.
Begin PSD3/PSR readiness now, even before formal publication.
PSD3 and PSR carry the heaviest operational weight for Europe. Enforced-parity dedicated interfaces end reliance on screen-scraping fallbacks, so banks need API performance upgrades ahead of transposition deadlines, with a shorter six-month window specifically for non-bank PSP access to central-bank systems.
Treat fraud control as a prerequisite for A2A scale, not an add-on.
The new fraud-liability regime is the bigger issue for PSPs: providers with inadequate fraud controls now bear liability for APP scams, an urgent concern given the UK’s £576.4 million in APP fraud losses in 2025 alone. A2A’s defining advantage: instant, irrevocable settlement, is also its principal risk when it comes to fraud.
Mind general stats but check individual payment system details independently.
On pricing, the often-cited 0.1–0.5% A2A cost figure lacks a verifiable source, so PSPs should lean on documented vendor pricing rather than that range when discussing costs with clients.
Distinguish promising A2A use cases beyond fee and speed
A2A payments are often instant and mostly cheaper than card payments. Yet, their efficiency is distributed unevenly. A2A works best in P2P, bill payments, and ecommerce checkout, and lags where banking UX and API quality are weaker. Value-added services such as Variable Recurring Payments (VRPs) for businesses also increasingly boost A2A systems utility. PSPs should prioritize investment accordingly.
Conclusion
A2A payment infrastructure is scaling fast in transaction value, per-transaction ceiling, and regulatory ambition. It still covers only 5% of ecommerce transactions, well behind digital wallets (37%) and credit cards (33%). At the same time, one should constantly look for most recent A2A statistics to get a genuine hold of the market. It is moving quickly enough that a number that was accurate eighteen months ago, e.g. UPI’s 86% concentration figure, can already be materially out of date.
Emerging use cases, updated transaction caps and new regulation directives also correct the A2A market directory every now and then. This article provides verified market numbers as of mid-2026, scrupulously examines legal trends and explains what the A2A payment stats mean for payment service providers, banks, and merchants.
Read more: